Independent Thinking®
Recessions: Predicting and Preparing
January 8, 2019
Many private-sector economists consider any period in which real GDP growth is negative for two consecutive quarters to be a recession. That sounds easier to pinpoint than it is. The official arbiter of such matters is the National Bureau of Economic Research, or NBER, a private, nonprofit, nonpartisan organization, which seldom declares a recession to have begun or ended until well after the fact.
For instance, the NBER stated in December 2008 that the last recession (what has come to be known as the Great Recession, which accompanied the global financial crisis) had actually begun a full year earlier, in December 2007. If it’s so difficult for the leading authority on the timing of recessions to gauge when one has started and ended, even well after the fact, is it possible to predict when one will occur?
While far from perfect, three economic and market signals have been the most accurate in predicting recessions: Leading Economic Indicators, or LEI, an inverted yield curve, and a bear market in stocks.
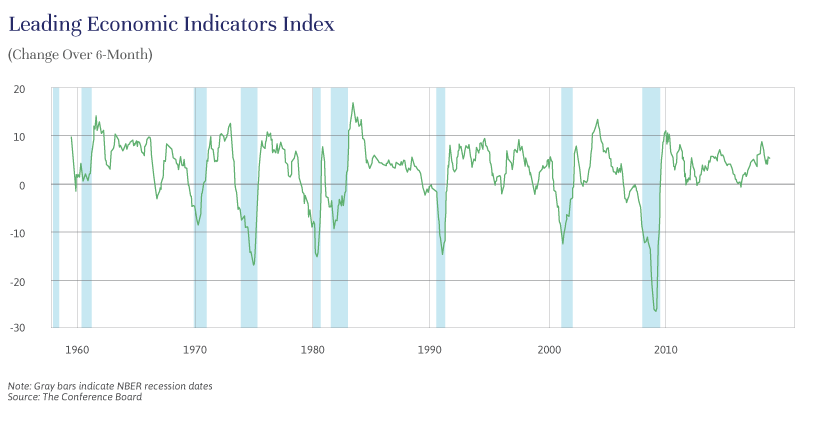
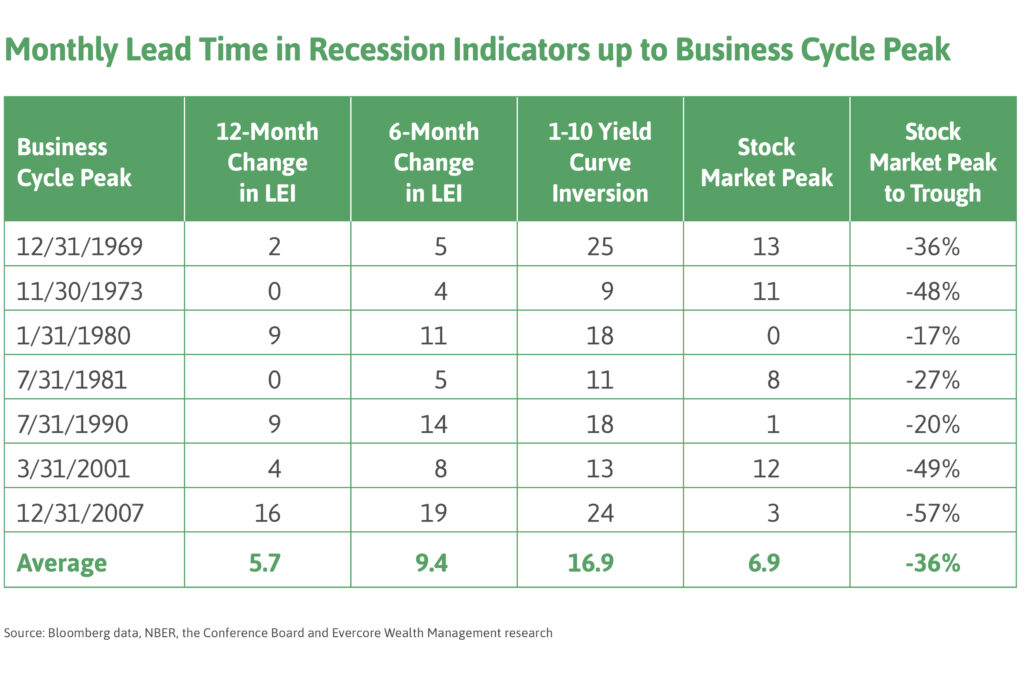
Leading Economic Indicators: LEI is a Conference Board index of 10 economic variables that tend to move before changes in the overall economy (two of these indicators happen to be the yield curve and the stock market). A decline in the index over six months has preceded every recession since the index’s inception in 1960. But its efficacy seems to be faulty, as demonstrated by a number of false positives, notably in 2011 and 2016. If we use the 12-month change in the index instead, it has fewer false positives, but the signal often comes too late, twice predicting recessions concurrent with the start of the downturn and almost always well after the stock market peak. Still, the LEI 12-month and six-month changes have turned negative six months and nine months, respectively, before a recession on average.

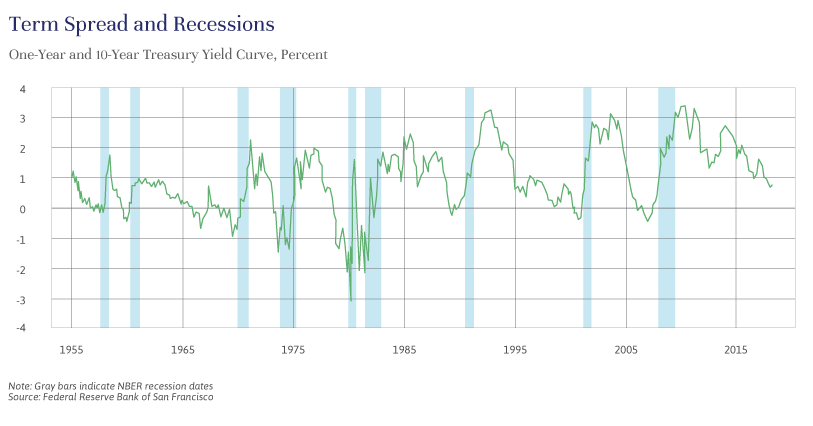
The Yield Curve: According to research by the Federal Reserve Bank of San Francisco, “a negative term spread, that is, an inverted yield curve, reliably predicts low future output growth and indicates a high probability of a recession.” Plenty of headlines have recently cited the inversion of two-year and five-year Treasury yields, as well as the yield curve inversion’s historical success in predicting recessions. Should we be worried?
While the yield curve has been the most accurate predictor of recessions, with an inversion of the curve before every recession in the last 60 years, neither the market nor academics focus on the differential between two- and five-year Treasuries. The Fed’s work looked at the difference between one-year and 10-year Treasury instruments, on the assumption that the term spread between those two securities provides the truest representation of the market’s forecast for the economy. The LEI uses the difference between the 10-year Treasury and the federal funds rate, the interest rate set by the Federal Reserve, on which banks can lend their reserves (or excess balances) to other banks on an overnight basis, as one of its components. Markets seem to focus most on the yield spread between two- and 10-year Treasuries.
In any case, when short-end Treasuries have a higher yield than longer-dated Treasuries, there is a high probability that a recession is coming. There have only been two false positives in the last 60 years: in 1965, which did see a significant decline in the pace of economic growth shortly afterward, although it took until 1969 for a recession to appear, and in September 1998, which saw the curve steepen before inverting again in March 2000, which was still 12 months before a recession began.
In the last recession, if investors had sold equities after the curve first inverted on December 27, 2005, they would have waited nearly 22 months until the market peaked on October 10, 2007, missing out on 28.5% appreciation, and a full two years before the start of the recession. On average, over the last seven recessions, acting at the moment of the first yield curve inversion, including the two false positives, would have meant selling 23 months before a recession and 16 months before a market peak. Even avoiding the false positives would have meant selling 17 months and 10 months ahead of the recessions and market peaks respectively. Is a signal worthwhile if it tells us so little about timing?

The Stock Market: Paul Samuelson, a Nobel Prize-winning economist, famously quipped in a column for Newsweek in 1966 that “Wall Street indexes predicted nine out of the last five recessions.” Fifty years on, this sentiment appropriately summarizes the stock market’s predictive power. Corrections (when the stock market is down 10%) and even bear markets (down 20%) have not accurately predicted the approach of recessions, although bear markets have fewer false positives than corrections.
The additional problem, of course, is that if the stock market is already down 20%, it may be too late to sell. The average peak-to-trough decline of the S&P 500 during the last 11 recessions was 30%, so once in bear market territory, the market could be two-thirds of the way to the bottom. Stock market peaks do usually come before a recession, but the time lag varies wildly; the market peaked just three months before the start of the recession in 2007 and a full year before the 2001 recession. Of course, the market only knows that a peak has occurred once we are in bear market territory, so a peak can only be understood after the fact.
The financial crisis was the longest (at 18 months) and deepest (GDP declined 4%, peak to trough) postwar recession, and it saw the steepest peak-to-trough stock market decline, 57%. However, large market declines are not only a function of the depth of the economic malaise. The recession of 2001, following the tech boom and bust, was among the shallowest recessions on record, lasting eight months and resulting in an economic decline of just 0.4%, peak to trough. But the stock market decline was significant, with the S&P 500 down 49%, largely due to the unprecedentedly high valuations that equities had reached. The recession of the early 1990s was also eight months, but stocks fell only 20%. Some recessions are not even accompanied by bear markets. The recessions of 1953, 1960 and 1980 saw market declines of less than 20%.

All three of the indicators we have discussed are flawed as independent signals, but even taken together, the strongest two, LEI and the yield curve, are problematic. When the yield curve inverts and the LEI reading simultaneously becomes negative, it is a good, albeit not certain, sign that a recession is probably coming in roughly the next nine months. But it still is not a great timing tool for selling stocks. In some cases, this dual signal has occurred after a significant stock drop, and in others the bull market still has had plenty of room to run. Furthermore, it provides no information on when to buy stocks back, or how deep the sell-off will be. With stock market timing, investors have to be right twice – when selling and when buying back – making the timing of portfolio changes based on these indicators very difficult.
So what protection does an investor have against significant market drops? Portfolio rebalancing and risk diversification are the most prudent defenses. As the equity market rises, active rebalancing, or bringing the equity allocation back down to a neutral proportion of a portfolio, and increasing exposure to more defensive and uncorrelated investments are wise. Diversification is an important tool in general, as long as it’s the underlying risk in a portfolio that is the object of the diversification, not just adjusting the number of stocks.
High-quality, interest-rate-sensitive bonds have been out of favor, but they have performed well in recessionary environments. With the Fed increasing short-term rates, there is more yield in bonds today than there has been in a decade, and more room for price appreciation if interest rates start to drop during an economic downturn. Bonds will serve as portfolio ballast during a recession.
Adding return streams that are truly uncorrelated to movements in stocks and bonds is also important. Investments such as insurance-linked securities, which gain exposure to catastrophe risks, certain types of secured lending, and health care royalties are examples of investments that are risky, have expected returns close to those of equity markets, and feature prices of the underlying investments that are less likely to be harmed by an economic downturn.
Close to 10 years into a bull market and economic expansion, there is plenty of reason for caution, and we closely watch for signs of the next downturn, focusing on LEI and the yield curve as potential signals, while recognizing their flaws. While the stock market remains skittish, the difference between the yields of one-year and 10-year Treasuries remains slightly positively sloped, and the LEI six-month change is solidly positive, giving us some comfort that we are still at least 12 to 24 months from the next recession. Staying fully invested, but vigilantly and actively rebalancing while ensuring portfolios have a fully diversified set of risks, is the best prescription.
Brian Pollak is a Partner and Portfolio Manager at Evercore Wealth Management. He can be contacted at [email protected].
